
Ragic Life Application: Tracking COVID-19 Statistics on Your Database

The outbreak of the virus has made our lives extremely inconvenient and difficult recently. Most of us are stuck in our homes waiting for it to end to return to our normal lives. Unfortunately, there is yet a sign of how or when this pandemic is going to end. The closest material we can obtain to have a better understanding of this deadly virus are the real-time statistics regarding it.
If you are in the United States or you have any type of connection with the country, you may want to obtain the statistics day by day of the country. Recently, a group of people have created The COVID Tracking Project to allow the world to understand the statistics of this pandemic in the United States. The statistics are updated daily for users to not only download the CSV files but to also integrate them with other software applications. And of course, you can easily integrate the statistics by using your Ragic database.
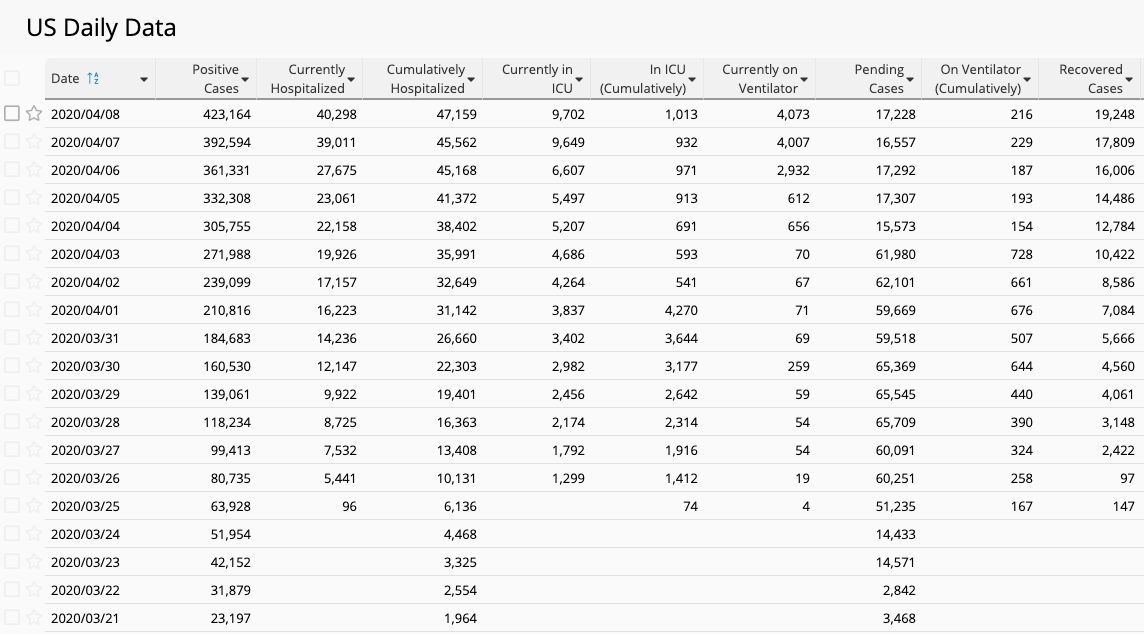
In the COVID tracking project, they provide detailed data of the virus cases of the country updated daily. This website provides the CSV file links which can be concatenated on your database by using periodic import from URL. First of all, you would need to download CSV files provided on the website and then create a new Ragic sheet by importing that CSV file directly onto your database. For this case, we have selected to use the statistics from the States Historic Data file.
Ragic will automatically design the fields needed in regards to your imported file. While importing, you would need to make sure that those fields are designed with the correct field types for your database to work properly (such as numeric fields and date fields). It will also be helpful if you selected a field to be unique, which will be the key field for your data. A good field would be the date field since there is always a new entry each date, and the date will not be repeated. In addition, you may then also edit the design of your fields as you wish. Things that you may want to change are the field names, sizes of fields, layouts of your form page and listing page, etc. These design changes will not affect the importing of data onto your database, you may change those designs as you wish.
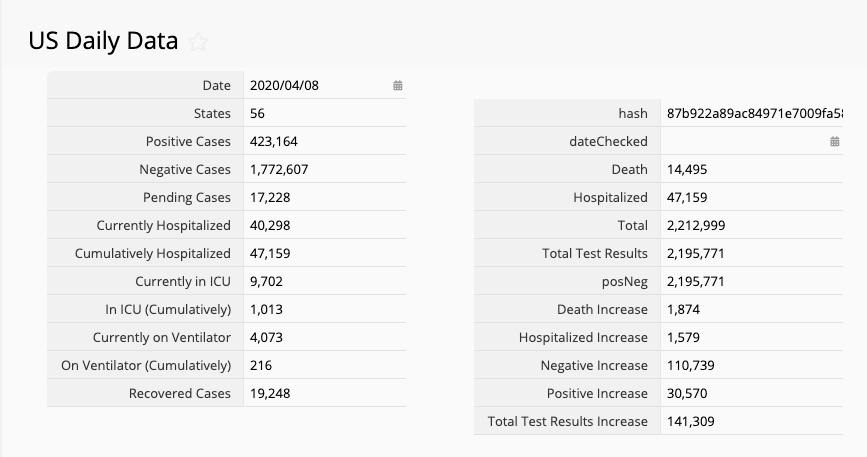
Now after you have completed the sheet design, it is now time to have your data automatically imported periodically from the COVID Tracking Project. To do this, first of all, you would need to obtain the link of the sheets’ CSV files by appending “.csv” at the end of the API URLs. And then onto your Ragic sheets, you can use those links to set as periodic imports. Finally, your database will then have the newest data every day.
Now the COVID Track Project updates its numbers between 4 PM and 5 PM EDT, so it might also be helpful to set your job schedules on Ragic around the same time so you’ll have the most up to date data as possible. You would not have to wait additional hours for the statistics to be imported on Ragic or needing to manually execute the workflow.
Other than just populating data periodically onto your sheets, you may definitely use the tools provided in the software. One tool that would be extremely popular in this case is the use of line graphs to see the status of “the curve”. With your records having at least one date field and one numeric field, you may create a line graph for it.
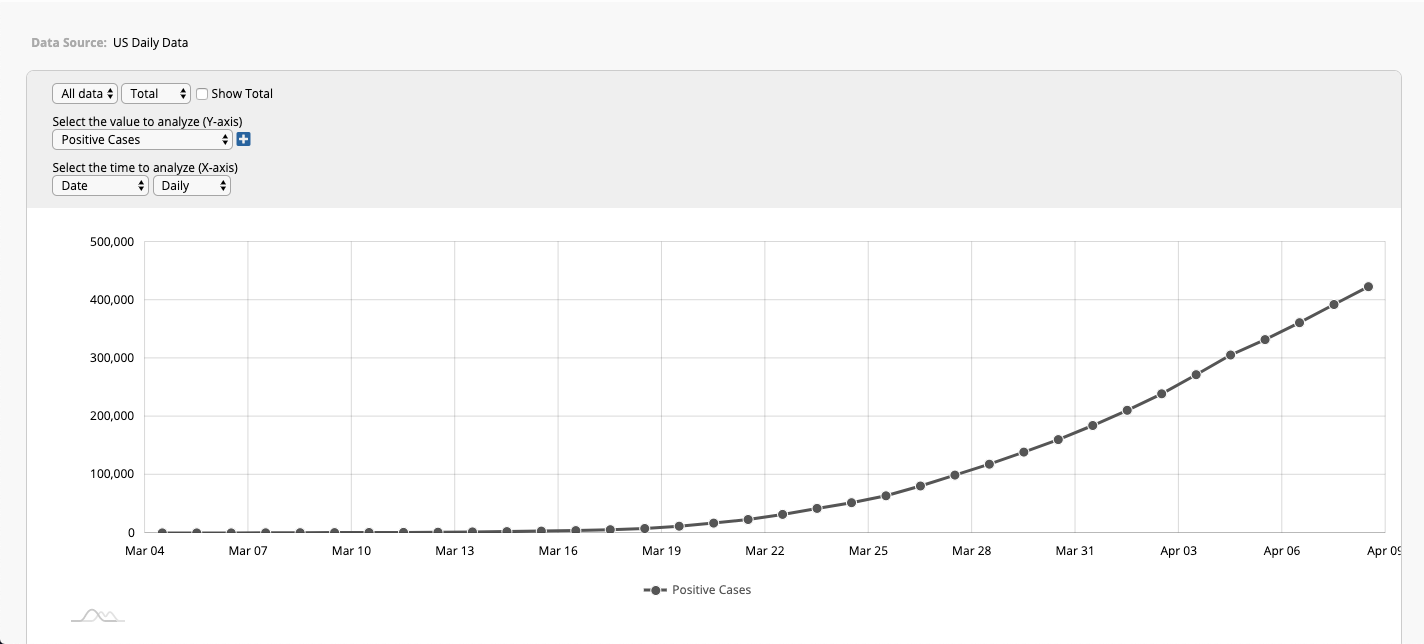
This is generated with the values on your date field as the horizontal axis, and the values on the selected numeric field will be the vertical axis.
As you can see from the graph, we can see that the positive cases are still increasing. You may also select other fields to analyze, such as the number of hospitalized cases per day or accumulated deaths.
After obtaining the data and have analyzed them on your database, it is now for us to “flatten the curve”. While most government officials in many countries are now trying very hard to suppress the increase of cases, it is also highly dependent on all of us to decrease and eventually stop the spread of the pandemic. This must be a collaborative effort with the participation of everyone to achieve the goal. Many organizations have now selected to have their employees work remotely from their homes or other private areas with the availability of many technology tools. These companies would definitely need to find ways for their members to communicate, alter their working methods suitable for online platforms, storing and processing data on a comprehensive database software, and many more obstacles. This process may seem to be a bit fretful and challenging in the beginning but will be highly beneficial for you and your colleagues not just for the current situation, but also for onwards after the pandemic crisis. You may refer to the article on how to work at home using technology tools.

To conclude, we all hope that the spread of the virus can end as soon as possible since it has heavily affected our health, work, and daily lives. We must all stay safe and healthy during this time period to battle against it collaboratively. If you at home working using Ragic to process your company data or if you are considering running Ragic for your company, you may always feel free to contact our support staff via email. We are always ready for anyone that would need any assistance regarding the use of Ragic.
Category: Applications > Use Cases

